
Kidbrooke property market and house prices
368 homes for sale · Updated 22 November 2026
What do homes cost in Kidbrooke?
Typical asking range
Half of homes in Kidbrooke ask between £395k and £626k
Across London, the middle half ask £410k to £1.4m. The dot is the median.
| Market | Range low | Median | Range high |
|---|---|---|---|
| Kidbrooke | £395,000 | £499,995 | £626,250 |
| London | £410,000 | £625,000 | £1,350,000 |
Prices by property type
Flats in Kidbrooke ask £425k, 22% less than London flats (£545k)
Median asking price of current listings; the count under each row
| property type | Kidbrooke | London |
|---|---|---|
| Flats (246 for sale) | £425,000 | £545,000 |
| Semi-detached (55 for sale) | £700,000 | £750,000 |
| Terraced (40 for sale) | £580,000 | £625,000 |
| Detached (11 for sale) | £900,000 | £1,895,000 |
Flats in Kidbrooke sold for a median £375k
Land Registry sales in the 12 months to March 2026
| property type | Kidbrooke |
|---|---|
| Flats (118 sales) | £375,000 |
| Semi-detached (48 sales) | £648,750 |
| Terraced (89 sales) | £475,000 |
The step from two to three bedrooms in Kidbrooke adds 33% to the asking price (London: 46%)
| size | Kidbrooke | London |
|---|---|---|
| 1 bed (70 for sale) | £330,000 | £350,000 |
| 2 beds (146 for sale) | £450,000 | £497,500 |
| 3 beds (96 for sale) | £599,950 | £725,000 |
| 4 beds (39 for sale) | £895,000 | £1,050,000 |
| 5+ beds (15 for sale) | £1,950,000 | £14,000,000 |
Price bands, size by type and price per square foot
Asking prices by type and size
Median asking price for every size and type on the market in Kidbrooke
| Size | Flat | Semi-det. | Terraced | Maisonette | All types |
|---|---|---|---|---|---|
| 1 bed | £328k68 | n/a | n/a | n/a | £330k70 |
| 2 beds | £450k121 | n/a | n/a | £350k13 | £450k146 |
| 3 beds | £650k32 | £630k25 | £495k11 | n/a | £600k96 |
| 4 beds | n/a | £820k20 | n/a | n/a | £895k39 |
| 5+ beds | n/a | £1.9m10 | n/a | n/a | £1.9m15 |
| All sizes | £430k224 | £700k55 | £513k16 | £350k14 | £500k368 |
Median asking price, with the number for sale below it. Combinations with fewer than 5 listings are shown as n/a. Types shown are the four most common in the area.
Asking prices by band
Homes for sale in Kidbrooke skew cheaper than in London
76% of Kidbrooke listings ask under £650k, a bigger share than London (51%)
| Price band | Kidbrooke listings | Kidbrooke share | London share |
|---|---|---|---|
| <£300k | 23 | 6% | 10% |
| £300k–400k | 74 | 20% | 13% |
| £400k–500k | 89 | 24% | 13% |
| £500k–650k | 92 | 25% | 15% |
| £650k–800k | 36 | 10% | 10% |
| £800k–1m | 22 | 6% | 7% |
| £1m–1.5m | 16 | 4% | 7% |
| £1.5m+ | 16 | 4% | 24% |
Price per square foot
191 matched sales
340 listings with a known floor area
London: £699 per sq ft
Sold prices per sq ft in Kidbrooke are up 17% over 10 years, to £540
Each point is the median across the 12 months ending on that date
| Window ends | Kidbrooke |
|---|---|
| Dec 2016 | £460 |
| Mar 2017 | £471 |
| Jun 2017 | £476 |
| Sept 2017 | £479 |
| Dec 2017 | £470 |
| Mar 2018 | £471 |
| Jun 2018 | £477 |
| Sept 2018 | £470 |
| Dec 2018 | £479 |
| Mar 2019 | £477 |
| Jun 2019 | £477 |
| Sept 2019 | £478 |
| Dec 2019 | £469 |
| Mar 2020 | £470 |
| Jun 2020 | £462 |
| Sept 2020 | £465 |
| Dec 2020 | £495 |
| Mar 2021 | £510 |
| Jun 2021 | £507 |
| Sept 2021 | £511 |
| Dec 2021 | £510 |
| Mar 2022 | £507 |
| Jun 2022 | £515 |
| Sept 2022 | £528 |
| Dec 2022 | £530 |
| Mar 2023 | £538 |
| Jun 2023 | £535 |
| Sept 2023 | £525 |
| Dec 2023 | £519 |
| Mar 2024 | £518 |
| Jun 2024 | £525 |
| Sept 2024 | £526 |
| Dec 2024 | £528 |
| Mar 2025 | £533 |
| Jun 2025 | £537 |
| Sept 2025 | £546 |
| Dec 2025 | £551 |
| Mar 2026 | £555 |
| Jun 2026 | £548 |
| Sept 2026 | £540 |
What does your money buy in Kidbrooke?
Your budget
In Kidbrooke, £450,000 buys two bedrooms, as a house or a flat.
That's based on 5 two-bedroom terraced houses for sale at a typical £450,000. Another bedroom in a house takes it to about £530,000.
Typical asking price for each size, from the homes we're tracking here today.
The same £450,000 nearby
| Area | House | Flat |
|---|---|---|
| Kidbrooke | 2 beds | 2 beds |
| Blackheath | None | 2 beds |
| Woolwich | 2 beds | 2 beds |
| Greenwich | None | 1 bed |
| Hither Green | None | 3 beds |
What are the homes like?
Property types for sale
Flats are 67% of homes for sale in Kidbrooke, against 68% across London
| property type | Kidbrooke | London |
|---|---|---|
| Flats (246 for sale) | 67% | 68% |
| Semi-detached (55 for sale) | 15% | 8% |
| Terraced (40 for sale) | 11% | 12% |
| Detached (11 for sale) | 3% | 6% |
What listings offer
Kidbrooke has more parking and more gardens and more chain-free homes than London.
London 53%
61% of listings have a garden; London: 53%. 226 of 368 listings have a garden. Counted from listing descriptions, so treat as a lower bound.London 47%
57% of listings have parking or a garage; London: 47%. 211 of 368 listings have parking or a garage. Counted from listing descriptions, so treat as a lower bound.London 24%
31% of listings are listed as chain-free; London: 24%. 113 of 368 listings are listed as chain-free. Counted from listing descriptions, so treat as a lower bound.Are prices in Kidbrooke rising or falling?
Homes sold in Kidbrooke
- 1 yearFlat£441k to £450k
- 5 years+6%£425k to £450k
- Since 2016+22%£370k to £450k
The median sold price in Kidbrooke is up 22% over the last 10 years, to £450k
Each point is the median over the 12 months ending on that date
| Window ends | Kidbrooke |
|---|---|
| Jun 2016 | £370k |
| Sept 2016 | £372k |
| Dec 2016 | £375k |
| Mar 2017 | £380k |
| Jun 2017 | £385k |
| Sept 2017 | £385k |
| Dec 2017 | £385k |
| Mar 2018 | £400k |
| Jun 2018 | £396k |
| Sept 2018 | £400k |
| Dec 2018 | £403k |
| Mar 2019 | £399k |
| Jun 2019 | £394k |
| Sept 2019 | £403k |
| Dec 2019 | £401k |
| Mar 2020 | £403k |
| Jun 2020 | £400k |
| Sept 2020 | £397k |
| Dec 2020 | £405k |
| Mar 2021 | £425k |
| Jun 2021 | £431k |
| Sept 2021 | £433k |
| Dec 2021 | £425k |
| Mar 2022 | £426k |
| Jun 2022 | £435k |
| Sept 2022 | £450k |
| Dec 2022 | £455k |
| Mar 2023 | £455k |
| Jun 2023 | £450k |
| Sept 2023 | £450k |
| Dec 2023 | £450k |
| Mar 2024 | £450k |
| Jun 2024 | £450k |
| Sept 2024 | £442k |
| Dec 2024 | £439k |
| Mar 2025 | £441k |
| Jun 2025 | £442k |
| Sept 2025 | £450k |
| Dec 2025 | £458k |
| Mar 2026 | £450k |
How many homes sell in Kidbrooke
Previous 12 months: 334 sales
261 homes sold in Kidbrooke in the 12 months to March 2026, 11% below Kidbrooke's five-year norm of 292 a year
Sales in the 12 months ending each quarter
| Window ends | Kidbrooke |
|---|---|
| Jun 2016 | 340 |
| Sept 2016 | 316 |
| Dec 2016 | 291 |
| Mar 2017 | 252 |
| Jun 2017 | 272 |
| Sept 2017 | 253 |
| Dec 2017 | 266 |
| Mar 2018 | 271 |
| Jun 2018 | 262 |
| Sept 2018 | 261 |
| Dec 2018 | 243 |
| Mar 2019 | 224 |
| Jun 2019 | 229 |
| Sept 2019 | 237 |
| Dec 2019 | 255 |
| Mar 2020 | 261 |
| Jun 2020 | 221 |
| Sept 2020 | 206 |
| Dec 2020 | 213 |
| Mar 2021 | 267 |
| Jun 2021 | 362 |
| Sept 2021 | 382 |
| Dec 2021 | 380 |
| Mar 2022 | 339 |
| Jun 2022 | 297 |
| Sept 2022 | 313 |
| Dec 2022 | 302 |
| Mar 2023 | 292 |
| Jun 2023 | 265 |
| Sept 2023 | 250 |
| Dec 2023 | 254 |
| Mar 2024 | 264 |
| Jun 2024 | 274 |
| Sept 2024 | 276 |
| Dec 2024 | 288 |
| Mar 2025 | 334 |
| Jun 2025 | 322 |
| Sept 2025 | 318 |
| Dec 2025 | 310 |
| Mar 2026 | 261 |
Recent sales in and around Kidbrooke
The newest completed sales registered with HM Land Registry
| Address | Sold | Type | Price |
|---|---|---|---|
| Flat 2, 104 Shooters Hill Road · SE3 8RLSE3 8RL · Sept 2026 · Flat · Leasehold | Sept 2026 | Flat · Leasehold | £580,000 |
| 116 Holburne Road · SE3 8HTSE3 8HT · Sept 2026 · Semi-detached · Freehold | Sept 2026 | Semi-detached · Freehold | £490,000 |
| 685 Westhorne Avenue · SE9 6JUSE9 6JU · Sept 2026 · Flat · Leasehold | Sept 2026 | Flat · Leasehold | £350,000 |
| 82 Dunblane Road · SE9 6RTSE9 6RT · Sept 2026 · Terraced · Freehold | Sept 2026 | Terraced · Freehold | £480,000 |
| Flat 19, Minerva Lodge, 25 - 30 Sweyn Place · SE3 0EZSE3 0EZ · Sept 2026 · Flat · Leasehold | Sept 2026 | Flat · Leasehold | £310,000 |
How busy is the market right now?
Homes came onto and left the Kidbrooke market at a similar pace
The last 30 days
↓ 11%
↓ 27%
↑ 42%
before going off the market
Changes compare with the prior 30 days.
Guide: How much to offer on a house
What's for sale in Kidbrooke now?
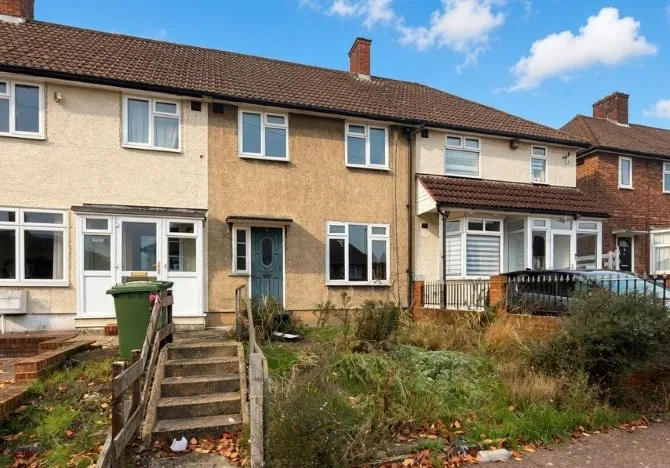
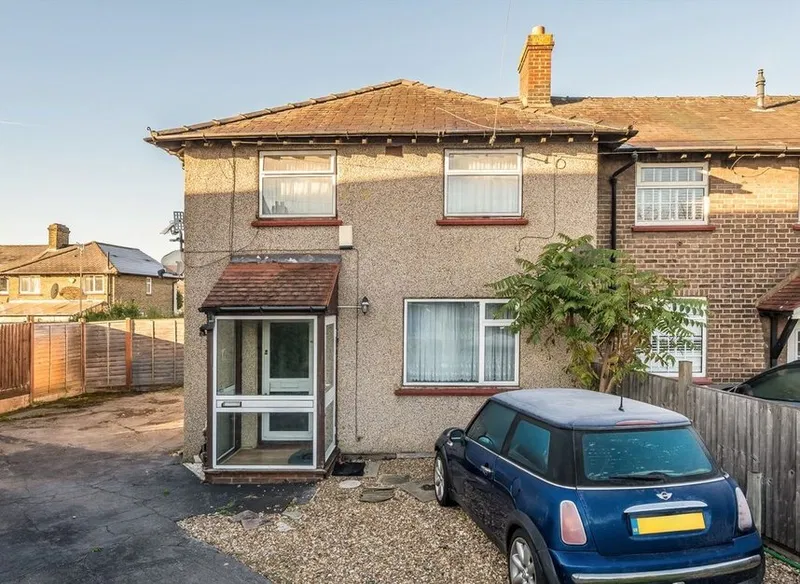
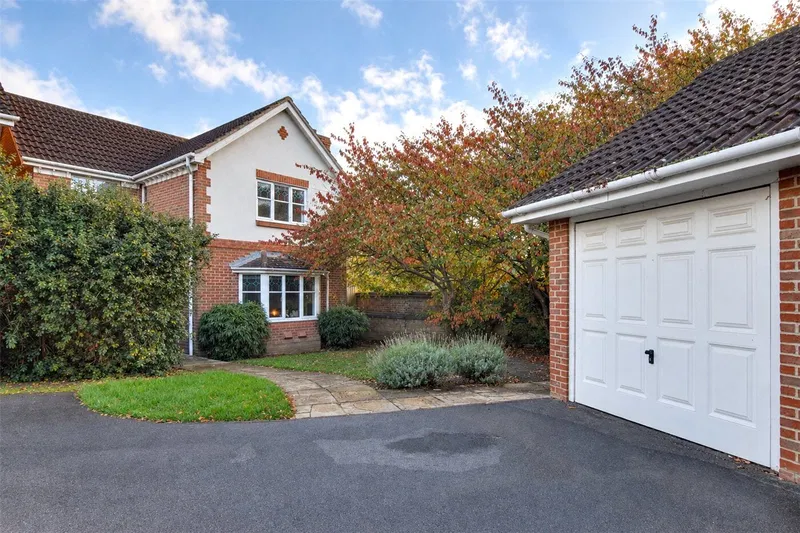
Current listings worth a look
Picked by simple rules, not adverts: cheapest, most space, gardens
How does Kidbrooke compare with nearby areas?
Where Kidbrooke is
Kidbrooke sits in east London, in Greenwich, about 7 miles from the centre.
How nearby areas compare
Current listings around Kidbrooke
| Area | For sale | Median asking | Median 2-bed | Houses |
|---|---|---|---|---|
| Kidbrooke | 368 | £500k | £450k | 29% |
| Blackheath | 797 | £500k | £470k | 27% |
| Woolwich | 774 | £427k | £410k | 22% |
| Greenwich | 1,034 | £500k | £500k | 16% |
| Hither Green | 311 | £425k | £375k | 37% |
| Canary Wharf | 1,226 | £550k | £600k | 3% |
| Lewisham | 716 | £412k | £400k | 24% |
| Londonbenchmark | 78,978 | £625k | £498k | 26% |
Questions about Kidbrooke
Kidbrooke property market: common questions
Where is Kidbrooke?
Kidbrooke sits in east London, in Greenwich, about 7 miles from the centre.
What is the average house price in Kidbrooke?
The typical asking price in Kidbrooke is £499,995, across the 368 homes for sale on 22 November 2026. That is the median: half of homes ask more and half ask less, so a few very expensive homes cannot drag it up. Half of listings ask between £395,000 and £626,250. That is 20% below London. Homes that actually sold in Kidbrooke went for a median £450,000 (Land Registry, 12 months to March 2026).
Are house prices in Kidbrooke rising or falling?
Rising over the long run, flat over the last year. Based on HM Land Registry completed sales, the median sold price in Kidbrooke is up 22% over the last 10 years and broadly flat over the last 12 months (12 months to March 2026). These medians compare the homes that happened to sell in each window, so they mix price movement with changes in what sold.
How much have house prices in Kidbrooke changed since 2016?
The median sold price in Kidbrooke is broadly flat over the last year, up 6% over five years and up 22% since 2016, from £370,000 to £450,000, based on HM Land Registry completed sales in the 12 months to each date. The latest window ends March 2026.
Is Kidbrooke cheaper than London?
Yes: asking prices in Kidbrooke are typically lower than across London. The median asking price in Kidbrooke is £499,995 against £625k across London: 20% below London. Some of that gap reflects what is for sale in each place rather than like-for-like value. The saving holds from the lower end to the top of the market.
7 more questions
How many homes are for sale in Kidbrooke?
We're tracking 368 homes for sale in Kidbrooke right now, broadly unchanged since 19 Oct, 48 of them listed in the last 30 days. Perch checks estate agents and portals every day.
Are house prices being cut in Kidbrooke?
36 listings in Kidbrooke had their asking price reduced in the last 30 days, about 10% of the homes currently for sale.
How long are homes on the market in Kidbrooke?
Of the Kidbrooke listings that came off the market in the last 30 days and that we first saw after we began tracking the area, the typical one had been advertised for 61 days. Coming off the market usually means sold subject to contract, but it can also mean withdrawn, so treat this as time advertised rather than time to sell.
How much do flats and houses cost in Kidbrooke?
The median asking price for a flat in Kidbrooke is £425,000. Houses are quoted by type rather than as one figure, because the mix moves the number more than the market does: the largest group on the market is semi-detached houses, at a median £700,000 across 55 listings. The Prices by property type chart on this page covers every type we track.
How much is a two-bedroom flat in Kidbrooke?
The median asking price for a two-bedroom flat in Kidbrooke is £450,000, across 139 current listings.
How much is a three-bedroom house in Kidbrooke?
There is no single three-bedroom house price: the largest group of three-bedroom houses for sale in Kidbrooke is terraced houses, at a median asking price of £530,000 across 25 listings. The Size × type view on this page covers every combination we track.
What is the price per square foot in Kidbrooke?
In Kidbrooke, homes that sold went for a median £540 per sq ft (HM Land Registry and EPC data), and current listings with a known floor area ask a median £573 per sq ft.
Watching the Kidbrooke market?
Perch checks every estate agent we track each morning and tells you about the new homes, price drops and off-market moves that match your search.
Set up your searchLooking at one home in Kidbrooke? Try the free house price checker
How these numbers are made
- Asking figures: Every listing we track across estate agents and portals (368 in Kidbrooke), refreshed daily, as of 22 November 2026. That is most of the market here but not every home, and we add more agents every week. We quote medians, never means, and suppress anything based on fewer than 5 listings.
- Off market and time listed: Off-market counts include only listings confirmed off the market after a short grace period; "typical time listed" is time advertised, not time to sell. We have tracked Kidbrooke since November 2025.
- London comparisons: The same daily snapshot taken across the whole of London, so both sides of every comparison share one basis. Where a comparison spans all property types, some of the gap reflects what is for sale here.
- Sold figures: HM Land Registry price paid data. Sold prices and sales counts cover the 12 months to March 2026; sold price per square foot covers the 12 months to September 2026, with floor areas from EPC certificates (the two run on different pipelines, and the latest months are left out while sales are still being registered). England and Wales; new-builds and non-standard transactions excluded.
Contains HM Land Registry data © Crown copyright and database right 2026, licensed under the Open Government Licence v3.0, and Energy Performance of Buildings Data: England and Wales © Crown copyright.